Data Analysis
Data analysis is a process of inspecting, cleansing, transforming, and modeling data with the goal of discovering useful information, informing conclusions, and supporting decision-making. 1
-

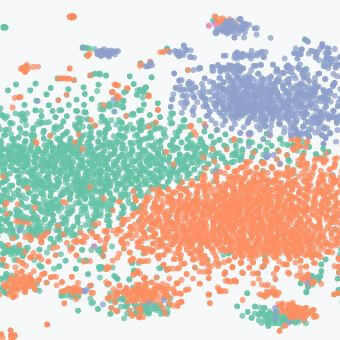
See that picture of a person? AI did that, and that person doesn’t exist.
-

Different types of data people: Machine Learning, Statistics, and Analytics
-
.png)
A brief rundown of methods/packages/ideas to generate synthetic data for self-driven data science projects and deep diving into machine learning methods.
-
Quickly becoming a regular check-in for ideas and methods for Data Science.
-
Chapter 6 of a series from Humanlytics complete with code examples and more.
-
If you are manipulating large datasets in excel and are tired of dealing with long wait times, check this out.
-

Killer environment to help you learn and test python, plus much more.
-

Creator of D3 and Observable. Former data scientist at the New York Times.
-

A roundabout tutorial to a SQL tool called the Data Build Tool (dbt).
-

You know those cool New York Times charts you see from time to time? They probably use this.
-

A collaborative platform for data science built by the founder of D3.
-
A poorly structured collection of relationship files helpful with matching back zip codes, counties, etc, to congressional disctricts.
-

Finished it. Pretty decent. Took notes.
-

Going to get to this after Codecademy.
-

Kind of want to check this out, but when I first looked, the docs were limited.
-

I honestly have no idea what this does yet, but I want to look into it. Looks like some kind of workflow management tool.
-

Supercharge your data pipeline using the Coding Is For Losers stack. From data collection to visualization, plus some extra tactics.
-

Another ETL with the option to create your own connectors; think of an ETL as Zapier or IFTTT but for data.
-

Just getting started exploring this one, but I can already see a world of possibilities.
-

This is LinkedIn’s Data on the Work Force. It includes where workers are leaving and where workers are going.
-

Link to the U.S. Bureau of Labor Statistics data section.
-

The Founder of Seer Interactive’s slideshare. Includes 50+ decks most recently on data visualization.
-
U.S. Census data in directory structure.
-

Directory of IRS individual income tax data by zip code and year.
-

If you’re new to reporting, check out this article and short video for some ideas to kickstart your dashboards.
-

I check this subreddit periodically for new ideas on data visualization. You’ll find the work of some very talented data scientists here.
-
Step by step guide to a 100,000+ headline analysis of clickbait using Apache Spark and Word2vec by Max Woolf.
-
A huge, community driven library of datasets with connectors to Power BI and Google Data Studio.
-

I need to do a better job keeping up with this one. Anyone dealing with Places or Planning should check this out.
-

Zillow’s collection of data on everything from zestimates to home sale counts and prices.
-

Fantastic data blog on cities.